1. ESP32 개발환경구축
ESP기본 개발환경구축 및 VSCode의 ESP32개발설치
https://docs.espressif.com/projects/esp-idf/en/latest/esp32/get-started/linux-setup.html
https://docs.espressif.com/projects/esp-idf/en/latest/esp32/get-started/index.html#step-1-install-prerequisites
https://docs.espressif.com/projects/esp-idf/en/latest/esp32/get-started/linux-setup.html
https://docs.espressif.com/projects/esp-idf/en/latest/esp32/get-started/index.html#step-1-install-prerequisites
- ESP32-OpenOCD
ESP32개발환경을 설치하면, 자동으로 아래의 Openocd가 설치가 되며, 없다면, 직접설치
- JTAG의 기본이해와 OpenOCD 관련내용
JTAG을 기본적으로 이해하고 OpenOCD로 어떻게 JTAG을 사용하는지 이해
- Raspberry Pi 에 OpenOCD 구성 및 구조이해
- /dev/ttyUSBx 권한문제
$ ls -al /dev/ttyUSB*           // 권한문제시 직접확인
crw-rw---- 1 root dialout 188, 0  4월 20 12:25 /dev/ttyUSB0
crw-rw-r-- 1 root plugdev 188, 1  4월 20 12:25 /dev/ttyUSB1
crw-rw-r-- 1 root plugdev 188, 2  4월 20 12:25 /dev/ttyUSB2

//각 Group 권한 추가
$ sudo usermod -a -G dialout jhlee  //serial
$ sudo usermod -a -G plugdev jhlee  //JTAG
or
// 직접 권한변경
$ sudo chmod a+rw /dev/ttyUSB0
- libusb 권한문제
Info : Configured 2 cores
  Info : Listening on port 6666 for tcl connections
  Info : Listening on port 4444 for telnet connections
  Error: libusb_open() failed with LIBUSB_ERROR_ACCESS
  Error: no device found
  Error: unable to open ftdi device with vid 0403, pid 6010, description '*', serial '*' at bus location '*'
문제 해결방법 (udev 권한 변경)
$ lsusb   // 현재 PID 와 VID (Product ID/ Vendor ID) 확인
...
Bus 001 Device 011: ID 0403:6010 Future Technology Devices International, Ltd FT2232C/D/H Dual UART/FIFO IC
...

$ sudo vi /etc/udev/rules.d/esp32link.rules
ATTRS{idVendor}=="0403", ATTRS{idProduct}=="6010", MODE="664", GROUP="plugdev"
- Window 10 (Zadig)
Zadig Download 진행 후 아래와 같이 Libusb/WinUSB 설정 진행

관련이슈내용
1.1 ESP32 Board 와 FT2232H Board 연결
- ESP32 Module과 FT2232 연결
 |
| https://docs.espressif.com/projects/esp-idf/en/latest/esp32/hw-reference/esp32/get-started-wrover-kit.html |
ESP사 FT2232HL Board 및 ESP32 Board 회로도
DataSheet
- ESP32 OpenOCD 와 GDB 동작구조
OpenOCD를 사용할 경우 GDB로 연결하여 동작하는데, 아래와 같이 연결되어 동작되어진다.
 |
| https://docs.espressif.com/projects/esp-idf/en/latest/esp32/api-guides/jtag-debugging/index.html |
- ESP32 Module 과 JTAG 연결
ESP32 Pin | JTAG Signal |
|---|---|
MTDO / GPIO15 | TDO |
MTDI / GPIO12 | TDI |
MTCK / GPIO13 | TCK |
MTMS / GPIO14 | TMS |
GND | GND |
- 직접 구성한 FT2232H 와 ESP32 Board
나의 경우 ESP32에서 제공하는 ESP사에 제공해주는 FT2332H Board가 없어서 기존의 FT2232H Board로 구성한 것이지만,
별도로 ESP에서 전용 Board를 판매하고 있으니,돈이 있다면, 직접 구입을 하면 편하다.

2. VS Code의 Espressif IDF 설치
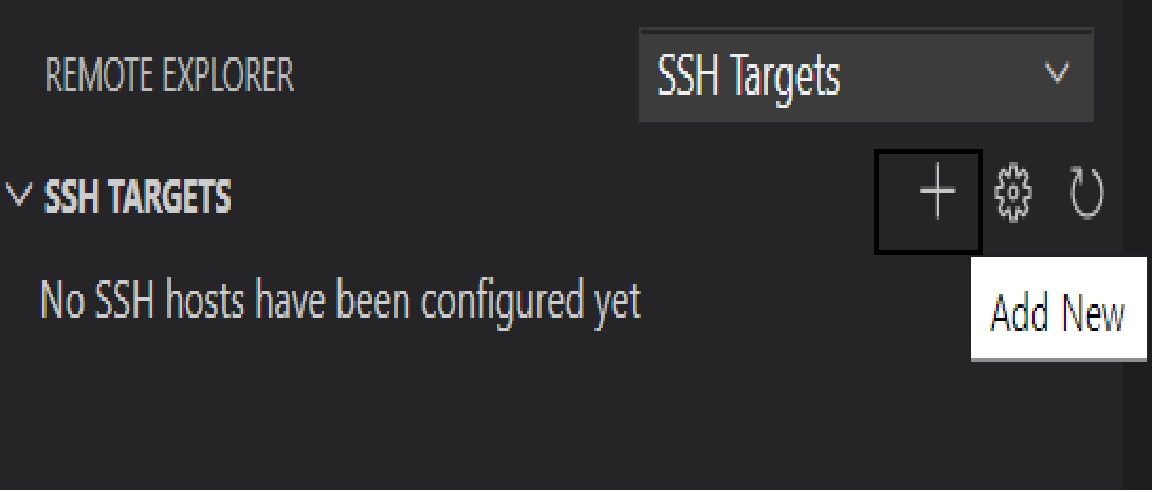
- VS Code의 Extension 에서 Espressif IDF 설치

VS Code에서 F1을 누르고, ESP로 치면, ESP-IDF 관련 많은 메뉴들이 존재하는 것을 볼 수 있다.
VS Code의 이 메뉴 없이 직접 python의 idf.py로 직접 Control로 가능하다.
idf.py는 esptool.py도 control하기 때문에 모두 idf.py command만 알아도 된다.
- 많이 사용하는 Menu들
- ESP-IDF: New Project
- ESP-IDF: Build your project
- ESP-IDF: Device configuration
- ESP-IDF: Flash(UART) your project
- ESP-IDF: Monitor your device
- ESP-IDF: OpenOCD Manager
- Terminal에서 직접 Command 입력
$ source ~/esp/esp-idf/export.sh

$ idf.py --help   //상위에서 제공되는 메뉴기능을 Command로 실행하면된다.
.......
Commands:
  all                    Aliases: build. Build the project.
  app                    Build only the app.
  app-flash              Flash the app only.
  bootloader             Build only bootloader.
  bootloader-flash       Flash bootloader only.
  build-system-targets   Print list of build system targets.
  clean                  Delete build output files from the build directory.
  confserver             Run JSON configuration server.
  create-component       Create a new component.
  create-project         Create a new project.
  efuse_common_table     Generate C-source for IDF's eFuse fields.
  efuse_custom_table     Generate C-source for user's eFuse fields.
  encrypted-app-flash    Flash the encrypted app only.
  encrypted-flash        Flash the encrypted project.
  erase_flash            Erase entire flash chip.
  erase_otadata          Erase otadata partition.
  flash                  Flash the project.
  fullclean              Delete the entire build directory contents.
  gdb                    Run the GDB.
  gdbgui                 GDB UI in default browser.
  gdbtui                 GDB TUI mode.
  menuconfig             Run "menuconfig" project configuration tool.
  monitor                Display serial output.
  openocd                Run openocd from current path
  partition_table        Build only partition table.
  partition_table-flash  Flash partition table only.
  post_debug             Utility target to read the output of async debug action and stop them.
  python-clean           Delete generated Python byte code from the IDF directory
  read_otadata           Read otadata partition.
  reconfigure            Re-run CMake.
  set-target             Set the chip target to build.
  show_efuse_table       Print eFuse table.
  size                   Print basic size information about the app.
  size-components        Print per-component size information.
  size-files             Print per-source-file size information.
  uf2                    Generate the UF2 binary with all the binaries included
  uf2-app                Generate an UF2 binary for the application only
- Monitor의 경우 별도의 Command
기본적으로 Exception이 나오면, add2line으로 분석을 해주며, bootloader에서 elf로 올려 분석을 해주는 것으로 보인다.
Ctrl + ] 는 모니터에서 Exit
2.1 VSCode의 Espressif IDF 설정
- 설치후 Espressif IDF 설정 확인
Flash 방법도 UART/JTAG으로 두가지 다 가능

- 별도의 OpenOCD 세부설정 존재
중요한 것은 이거의 주내용은 Flash Type 관련설정이며, ESP OpenOCD의 위치파악 가능 및 설정확인가능
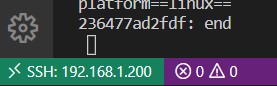
- UART이면, 해당 Port로 연결
- JTAG이면, 해당 Port로 연결

ESP32-OpenOCD에서 확인
$ ls ~/.espressif/tools/openocd-esp32/v0.10.0-esp32-20200709/openocd-esp32/share/openocd/scripts/board/esp32*     //OpenOCD Board 설정 (Interface/Target 분석)
/home/jhlee/.espressif/tools/openocd-esp32/v0.10.0-esp32-20200709/openocd-esp32/share/openocd/scripts/board/esp32-ethernet-kit-3.3v.cfg
/home/jhlee/.espressif/tools/openocd-esp32/v0.10.0-esp32-20200709/openocd-esp32/share/openocd/scripts/board/esp32-solo-1.cfg
/home/jhlee/.espressif/tools/openocd-esp32/v0.10.0-esp32-20200709/openocd-esp32/share/openocd/scripts/board/esp32-wrover-kit-1.8v.cfg
/home/jhlee/.espressif/tools/openocd-esp32/v0.10.0-esp32-20200709/openocd-esp32/share/openocd/scripts/board/esp32-wrover-kit-3.3v.cfg
/home/jhlee/.espressif/tools/openocd-esp32/v0.10.0-esp32-20200709/openocd-esp32/share/openocd/scripts/board/esp32-wrover.cfg
/home/jhlee/.espressif/tools/openocd-esp32/v0.10.0-esp32-20200709/openocd-esp32/share/openocd/scripts/board/esp32s2-kaluga-1.cfg

$ vi ~/.espressif/tools/openocd-esp32/v0.10.0-esp32-20200709/openocd-esp32/share/openocd/scripts/board/esp32-wrover-kit-3.3v.cfg //현재 사용중인 config (Target/Inferface)
2.2 OpenOCD 연결 및 에러사항
상위 ESP-IDF 메뉴 중 OpenOCD Manager를 이용하여 간단하게 실행가능하며, 직접 idf.py를 이용하여 실행해도 상관없다.
- OpenOCD 기본 동작확인
Open On-Chip Debugger  v0.10.0-esp32-20200709 (2020-07-09-08:54)
Licensed under GNU GPL v2
For bug reports, read
	http://openocd.org/doc/doxygen/bugs.html
adapter speed: 20000 kHz

Info : Configured 2 cores
Info : Listening on port 6666 for tcl connections
Info : Listening on port 4444 for telnet connections
Info : ftdi: if you experience problems at higher adapter clocks, try the command "ftdi_tdo_sample_edge falling"
Info : clock speed 20000 kHz
Info : JTAG tap: esp32.cpu0 tap/device found: 0x120034e5 (mfg: 0x272 (Tensilica), part: 0x2003, ver: 0x1)
Info : JTAG tap: esp32.cpu1 tap/device found: 0x120034e5 (mfg: 0x272 (Tensilica), part: 0x2003, ver: 0x1)
Info : esp32: Debug controller 0 was reset.
Info : esp32: Core 0 was reset.
Info : esp32: Debug controller 1 was reset.
Info : esp32: Core 1 was reset.
Info : Listening on port 3333 for gdb connections
- OpenOCD 에러
아래 에러는 대부분 제대로 연결이 안되거나, FT2332H는 Channel이 두개인데, Channel 설정오류 즉 연결(Interface)에서 잘되지 않은 것이므로,
HW으로는 연결사항을 확인하고, SW는 Channel 설정사항을 세부적으로 살펴 보자.
open On-Chip Debugger  v0.10.0-esp32-20200709 (2020-07-09-08:54)
  Licensed under GNU GPL v2
  For bug reports, read
      http://openocd.org/doc/doxygen/bugs.html
  adapter speed: 20000 kHz

  Info : Configured 2 cores
  Info : Listening on port 6666 for tcl connections
  Info : Listening on port 4444 for telnet connections
  Info : ftdi: if you experience problems at higher adapter clocks, try the command "ftdi_tdo_sample_edge falling"
  Info : clock speed 20000 kHz
  Error: JTAG scan chain interrogation failed: all ones
  Error: Check JTAG interface, timings, target power, etc.
  Error: Trying to use configured scan chain anyway...
  Error: esp32.cpu0: IR capture error; saw 0x1f not 0x01
  Warn : Bypassing JTAG setup events due to errors
  Info : Listening on port 3333 for gdb connections
- OpenOCD 세부설정 확인
나의 경우 Channel A가 동작이되지 않아 아래와 같이 Channel B로 소스 수정하여 동작가능
$ vi ~/.espressif/tools/openocd-esp32/v0.10.0-esp32-20200709/openocd-esp32/share/openocd/scripts/interface/ftdi/esp32_devkitj_v1.cfg
#
# Driver for the FT2232H JTAG chip on the Espressif DevkitJ board
# (and most other FT2232H and FT232H based boards)
#


interface ftdi
ftdi_vid_pid 0x0403 0x6010 0x0403 0x6014

#
# interface 0 channle A
# interface 1 channel B (나의 경우 현재 Channel B로 사용)
ftdi_channel 1

#
# ftdi_layout_init 0x0008 0xf00b
#
# 0x0008 0x000b  JTAG 설정
# TCK, TDI, TDO, TMS: ADBUS0-3
#
# 0x0000 0xf000 LED 설정
# LEDs: ACBUS4-7

ftdi_layout_init 0x0008 0xf00b
ftdi_layout_signal LED -data 0x1000
ftdi_layout_signal LED2 -data 0x2000
ftdi_layout_signal LED3 -data 0x4000
ftdi_layout_signal LED4 -data 0x8000
....
이외 VS Code로 사용할 경우 중복 실행되는 경우 및 설정이 잘못되는 경우가 많으므로, 관련부분을 확인하자.
2.3 App Tracer 사용
상위 상태에서 IDF App Tracer -> Start App Trace를 실행해보면 동작되는 것을 확인가능하며, 관련 설정은 아래를 참고해서 미리 해두자.
APP Trace
Heap Trace
- VSCode 기반으로 OpenOCD 사용예제
일반예제로는 좌측의 Tracer 이용하여 사용하지만 제대로 동작되지는 않는 것을 확인

- App tracer의 사용법
Application Level의 JTAG을 사용하고자 한다면, 반드시 sdkdefault에 설정을 추가하고 아래의 Manaul대로 설정하자.
 |
| https://docs.espressif.com/projects/esp-idf/en/latest/esp32/api-guides/app_trace.html |
- ESP32의 App Trace 사용예제
ESP32의 Example에 App Trace를 사용하여 Debug하는 예제가 존재하는데, 이 기반으로 테스트 진행
반드시 sdkconfig의 설정과 별도의 esp함수가 필요하므로, 세부사항은 상위를 참조
아래의 App Trace 예제를 보면, ADC Sampling을 하는데, 한번은 app trace를 이용하고 한번은 UART로 보여주는 방식으로 아주 기초적으로 사용하는 방식같다.
- Trace Log 분석

3. GDB 기반의 Visual Display 도구들
JTAG을 사용하면, GDB는 사용해야 하며, 이 기반으로 손쉽게 디버깅할 수 있도록 하는 것이 중요한데, 예전것들 부터 보면 아래와 같다.
- gdbtui
gdb에서 제공하는 가장 기본적인 Dispaly로 문자 중심으로 표시를 해주는데, 사용한 일이 거의 없다.
- ddd
예전에 내가 많이 사용했던 GDB기반의 Display 이지만, Eclipse기반의 Tool들이 나오면서 거의 사용할일이 사실 없다.
- Eclipse기반의 Tool들
요즘 대부분의 유명 Chip Vendor사들은 회사마다 자신만의 Eclipse기반의 Tool을 가지고 있어 이 기반으로 손쉽게 gdb 를 사용가능하다.
- gdbgui
이것은 이번에 나도 처음알게된 것인데 Web broswser 기반으로 동작하는데, 괜찮은 Tool 같은데, 처음 설정이 꼬이면, 제대로 동작이 안되는 것 같다.
- visualgdb
VisualStudio기반의 유료로 30일만 사용가능 (이전 OpenOCD에 자세히 설명)
3.1 ESP32 OpenOCD 기반의 GDB 사용법
- ESP32의 OpenOCD Ecplise 연결 방법
ESP Manual을 보면 쉽게 Ecplise에 연결하고 gdbgui를 사용을 언급을 하고 있다.
Ecplise 기반은 많이 해보았기에, gdbgui로 해보기로 하자.
- ESP32 TEST Program 기반 현재 상태 확인
이전에 만들었던, exaplme로 간단하게 현재 상태를 간단히 분석해보고 gdb 명령과 gdb를 실행해보자.
$ source ~/esp/esp-idf/export.sh    // Ubuntu 20.04기반으로 해서 기본 Python 3으로 됨
Setting IDF_PATH to '/home/jhlee/esp/esp-idf'
Detecting the Python interpreter
Checking "python" ...
Command 'python' not found, did you mean:
  command 'python3' from deb python3
  command 'python' from deb python-is-python3
Checking "python3" ...
Python 3.8.5
"python3" has been detected
Adding ESP-IDF tools to PATH...
Using Python interpreter in /home/jhlee/.espressif/python_env/idf4.4_py3.8_env/bin/python    // python3기반으로 virtulenv 설정
Checking if Python packages are up to date...
The following Python requirements are not satisfied:        // 다음과 같은 문제가 발생 , 다시 설치해도 동일
gdbgui==0.13.2.0
pygdbmi<=0.9.0.2
To install the missing packages, please run "/home/jhlee/esp/esp-idf/install.sh"
Diagnostic information:
    IDF_PYTHON_ENV_PATH: /home/jhlee/.espressif/python_env/idf4.4_py3.8_env
    Python interpreter used: /home/jhlee/.espressif/python_env/idf4.4_py3.8_env/bin/python


$ cat build/gdbinit  //gdb init 명령어확인
file /home/jhlee/project-name/build/app_trace_to_host.elf
target remote :3333
mon reset halt
flushregs
thb app_main
c


$ xtensa-esp32-elf-gdb -x build/gdbinit build/app_trace_to_host.elf   //gdb test 진행시 에러 발생 python 2.7필요
xtensa-esp32-elf-gdb: error while loading shared libraries: libpython2.7.so.1.0: cannot open shared object file: No such file or directory

$ ll /usr/bin/py*  //Ubuntu 20.04에는 python2 가 없음

$ which python
/home/jhlee/.espressif/python_env/idf4.4_py3.8_env/bin/python

$ sudo apt-get install libpython2.7           //설치 진행

$ xtensa-esp32-elf-gdb -x build/gdbinit build/app_trace_to_host.elf   //재진행
....
Type "apropos word" to search for commands related to "word"...
Reading symbols from build/app_trace_to_host.elf...done.
build/gdbinit:2: Error in sourced command file:
:3333: 연결 시간 초과.
- OpenOCD와 GDB 기본 테스트 진행
 $ idf.py openocd    //openocd 만 TEST 및 tcl/gdb/telnet server 동작확인
Executing action: openocd
Note: OpenOCD cfg not found (via env variable OPENOCD_COMMANDS nor as a --openocd-commands argument)
OpenOCD arguments default to: "-f board/esp32-wrover-kit-3.3v.cfg"
OpenOCD started as a background task 43585
Executing action: post_debug
Open On-Chip Debugger  v0.10.0-esp32-20200709 (2020-07-09-08:54)
Licensed under GNU GPL v2
For bug reports, read
        http://openocd.org/doc/doxygen/bugs.html
Info : Configured 2 cores
Info : Listening on port 6666 for tcl connections
Info : Listening on port 4444 for telnet connections
Info : ftdi: if you experience problems at higher adapter clocks, try the command "ftdi_tdo_sample_edge falling"
Info : clock speed 20000 kHz
Info : JTAG tap: esp32.cpu0 tap/device found: 0x120034e5 (mfg: 0x272 (Tensilica), part: 0x2003, ver: 0x1)
Info : JTAG tap: esp32.cpu1 tap/device found: 0x120034e5 (mfg: 0x272 (Tensilica), part: 0x2003, ver: 0x1)
Info : Target halted. CPU0: PC=0x400D55BC (active)
Info : Target halted. CPU1: PC=0x400E4926
Info : Listening on port 3333 for gdb connections


$ idf.py openocd gdb                  // openocd 와 gdb TEST 진행 문제없음
or
$ idf.py openocd gdb   build/app_trace_to_host.elf
........
esp32: Core 1 was reset.
Target halted. CPU0: PC=0x40000400 (active)
Target halted. CPU1: PC=0x40000400
Hardware assisted breakpoint 1 at 0x400d55bc: file ../main/app_trace_to_host_example_main.c, line 92.
Target halted. CPU0: PC=0x400D55BC (active)
Target halted. CPU1: PC=0x400E4926
[New Thread 1073446776]
[New Thread 1073444120]
[New Thread 1073430168]
[New Thread 1073434616]
[New Thread 1073413208]
[New Thread 1073437016]
[Switching to Thread 1073441464]

Thread 1 hit Temporary breakpoint 1, app_main () at ../main/app_trace_to_host_example_main.c:92
---Type return to continue, or q return to quit---
92      {
(gdb)


$ idf.py openocd gdbtui   // 엔터를  몇번 치면 소스 가 보임
or
$ idf.py openocd gdbtui  build/app_trace_to_host.elf

   ┌──../main/app_trace_to_host_example_main.c────────────────────────────────────────────────────────────────────────────────────────────────────────────────────────────────────────────────────────────────────────────────────────────────────┐
   │88       * and logging results with application tracing to the host                                                                                                                                                                           │
   │89       * as well as for comparison printing out sampling result to UART                                                                                                                                                                     │
   │90       */                                                                                                                                                                                                                                   │
   │91      void app_main(void)                                                                                                                                                                                                                   │
H+>│92      {                                                                                                                                                                                                                                     │
   │93          ESP_LOGI(TAG, "Enabling ADC1 on channel 6 / GPIO%d.", ADC1_CHANNEL_6_GPIO_NUM);                                                                                                                                                   │
   │94      #if CONFIG_IDF_TARGET_ESP32                                                                                                                                                                                                           │
   │95          adc1_config_width(ADC_WIDTH_BIT_12);                                                                                                                                                                                              │
   │96      #elif CONFIG_IDF_TARGET_ESP32S2                                                                                                                                                                                                       │
   │97          adc1_config_width(ADC_WIDTH_BIT_13);                                                                                                                                                                                              │
   │98      #endif                                                                                                                                                                                                                                │
   └──────────────────────────────────────────────────────────────────────────────────────────────────────────────────────────────────────────────────────────────────────────────────────────────────────────────────────────────────────────────┘
remote Remote target In: app_main                                                                                                                                                                                             L92   PC: 0x400d55bc
[New Thread 1073413208]
[New Thread 1073437016]
[Switching to Thread 1073441464]

---Type return to continue, or q return to quit---
Thread 1 hit Temporary breakpoint 1, app_main () at ../main/app_trace_to_host_example_main.c:92
(gdb)  quit
3.2 OpenOCD 기반의 gdbgui 1차 TEST 진행
결론적으로 제대로 사용해보지 못했으며, 원인은 Version 간의 문제로 보이며, 시간이 없어 이부분 추후에 다시 해보도록 하며, 관련내용을 아래에 기술한다.
아래내용을 이해하기위해서는 python의 virtual env를 이해해야한다.
- gdbgui 만 별도 테스트
gdbgui 의 경우만 제대로 동작이 되지 않아 이에 관련하여 별도로 테스트를 진행
$ idf.py openocd gdbgui   // 제대로 실행은 되지만 Webbrowser 에서 제대로 동작되지 않음
or
$ idf.py  openocd gdbgui monitor -p /dev/ttyUSB0
Executing action: openocd
Note: OpenOCD cfg not found (via env variable OPENOCD_COMMANDS nor as a --openocd-commands argument)
OpenOCD arguments default to: "-f board/esp32-wrover-kit-3.3v.cfg"
OpenOCD started as a background task 33824
Executing action: gdbgui
gdbgui started as a background task 33825
Executing action: post_debug
Open On-Chip Debugger  v0.10.0-esp32-20200709 (2020-07-09-08:54)
Licensed under GNU GPL v2
For bug reports, read
        http://openocd.org/doc/doxygen/bugs.html
Info : Configured 2 cores
Info : Listening on port 6666 for tcl connections
Info : Listening on port 4444 for telnet connections
Info : ftdi: if you experience problems at higher adapter clocks, try the command "ftdi_tdo_sample_edge falling"
Info : clock speed 20000 kHz
Info : JTAG tap: esp32.cpu0 tap/device found: 0x120034e5 (mfg: 0x272 (Tensilica), part: 0x2003, ver: 0x1)
Info : JTAG tap: esp32.cpu1 tap/device found: 0x120034e5 (mfg: 0x272 (Tensilica), part: 0x2003, ver: 0x1)
Info : Listening on port 3333 for gdb connections
gdbgui 사용법
- esp gdbgui 문제사항 확인
$ which gdbgui
/home/jhlee/.espressif/python_env/idf4.4_py3.8_env/bin/gdbgui

$ gdbgui   // idf에 기본설치된 gdbgui 만 테스트 진행
frozen importlib._bootstrap:219: RuntimeWarning: greenlet.greenlet size changed, may indicate binary incompatibility. Expected 144 from C header, got 152 from PyObject
frozen importlib._bootstrap:219: RuntimeWarning: greenlet.greenlet size changed, may indicate binary incompatibility. Expected 144 from C header, got 152 from PyObject
frozen importlib._bootstrap:219: RuntimeWarning: greenlet.greenlet size changed, may indicate binary incompatibility. Expected 144 from C header, got 152 from PyObject
frozen importlib._bootstrap:219: RuntimeWarning: greenlet.greenlet size changed, may indicate binary incompatibility. Expected 144 from C header, got 152 from PyObject
frozen importlib._bootstrap:219: RuntimeWarning: greenlet.greenlet size changed, may indicate binary incompatibility. Expected 144 from C header, got 152 from PyObject
Opening gdbgui with default browser at http://127.0.0.1:5000
exit gdbgui by pressing CTRL+C
frozen importlib._bootstrap:219: RuntimeWarning: greenlet.greenlet size changed, may indicate binary incompatibility. Expected 144 from C header, got 152 from PyObject
frozen importlib._bootstrap:219: RuntimeWarning: greenlet.greenlet size changed, may indicate binary incompatibility. Expected 144 from C header, got 152 from PyObject
세그멘테이션 오류 (core dumped)   //idf에 기본설치된 gdbgui는 제대로 동작이 안됨

$ pip freeze | grep greenlet   //greenlet 문제로 보고 관련 version 확인
greenlet==1.0.0

$ pip freeze | grep gdb*   //gdbgui version 확인
gdbgui==0.13.2.0
pygdbmi==0.9.0.2
- 일반 gdbgui 테스트 진행 (python3)
$ which gdbgui        //pip3 install gdbgui 별도 설치
/home/jhlee/.local/bin/gdbgui

$ gdbgui --version
0.14.0.2

$ pip3 freeze | grep greenlet
greenlet==0.4.16

$ gdbgui   //제대로 동작되는 것을 확인
Opening gdbgui with default browser at http://127.0.0.1:5000
View gdbgui dashboard at http://127.0.0.1:5000/dashboard
exit gdbgui by pressing CTRL+C

- esp gdbgui upgrade 하기로 결정
외부 python3.8 package가 아니며, virtual env 안에서만 upgrade 진행
//source ~/esp/esp-idf/export.sh 진행했기때문에 esp virtual env 사용
$ which gdbgui      //esp 개발안정버전 4.4 의 python virtual env에 gdbgui 가 설치됨
/home/jhlee/.espressif/python_env/idf4.4_py3.8_env/bin/gdbgui   //문제는 python3.8기반으로 구성되었으며, 나또한 python3으로 하고싶지만, 동작되지 않음

$ gdbgui --version
0.13.2.0

$ pip install --upgrade gdbgui     //esp virtual env의 gdbgui upgrade 진행

$ gdbgui --version
0.14.0.2

$ gdbgui //esp virtual env 에서도 gdbgui 기본동작되는 것확인완료 (역시 version문제)
Opening gdbgui with default browser at http://127.0.0.1:5000
View gdbgui dashboard at http://127.0.0.1:5000/dashboard
exit gdbgui by pressing CTRL+C

$ idf.py openocd gdbgui  // esp openocd 와 gdbgui 기본테스트 진행했지만, Version 문제발생
The following Python requirements are not satisfied:
gdbgui==0.13.2.0
pygdbmi<=0.9.0.2
To install the missing packages, please run "/home/jhlee/esp/esp-idf/install.sh"
Diagnostic information:
    IDF_PYTHON_ENV_PATH: /home/jhlee/.espressif/python_env/idf4.4_py3.8_env
    Python interpreter used: /home/jhlee/.espressif/python_env/idf4.4_py3.8_env/bin/python
....

$ vi ~/esp/esp-idf/requirements.txt  // version check 하는 부분 수정 (에러는 없어지지만, 제대로 동작되지 않음)
현재 나의 local에 설치하여 gdbgui 별도로 설치하여 동작되는 것을 확인 했지만, idf.py는 python virutal env기반으로 동작되기 때문에 version이 다르다.
그래서 이를 업그레이드 했지만, idf.py의 내부에서 gdbgui 0.13.2.0 version check하는 부분이 있어 제대로 실행되지 않는다.
version 체크 하는 부분까지도 다 고쳐서 사용할까도 생각했지만, 나중에 다시 테스트도 해야하니, 이 부분은 다시 원상복귀 하기도 결정했다.
상위와 유사한 상황
- OpenOCD GDBGUI 1차 TEST 결론
현재 아래 Manual (최신 Version 4.4) 로 보더라도, Python3으로 설치를 진행하라고 되어있는데, Python2가 필요한 거 보면, 현재도 개발중인 것으로 보이며,
추후 시간이 된다면, Python2로 변경 후 다시 시도를 해보아도 괜찮을 것 같은데, 다른 부작용이 왠지 있을 것 같다.
3.3 OpenOCD 기반의 gdbgui 2차 TEST 진행
기존에 Python3만 동작되었기에, Python2 설치 후 virtual env도 Python2로 바꾸려고 했는데, 실패했다.
현재 python2 설치되었으며, ESP32는 python3의 virtualenv를 그대로 사용함
$ sudo apt install python2

$ sudo ln -s /usr/bin/python2 /usr/bin/python

$ ~/esp/esp-idf/install.sh
일주일 후 다시 시도 후 갑자기 작동되는데, 이전에 왜 동작이 안되었는지 모르겠지만, 다음에 다시 시도 할 경우 다시 해봐야겠음
며칠사이에 다른 것이 변경이 되었는지, 모르겠음
$ cd ~/project-name   // 이전과 동일한 Project
CMakeLists.txt  Makefile  README.md  build  debug.log  example_test.py  main  sdkconfig  sdkconfig.ci  sdkconfig.defaults  trace

$ . esp/esp-idf/export.sh

$ which gdbgui
/home/jhlee/.espressif/python_env/idf4.4_py3.8_env/bin/gdbgui

$ gdbgui --version
0.13.2.0

$ idf.py openocd gdbgui
or
$ idf.py openocd gdbgui monitor -p /dev/ttyUSB1
Web browser 기반으로 쉽게 Break Point를 쉽게 설정하고, 실행하니 편하다.

우측 정보기반으로 Ecplise 처럼 쉽게 Trace도 가능하다

Web Browser에서 실행해서 좋은데, Ecplise 처럼 안정적이지는 못한것으로 보이는데, 잘 사용하면 괜찮을 것 같다.
- OpenOCD GDBGUI 2차 TEST 결론
현재 잘 동작하며, 1차 TEST 때 왜 동작이 안되었는지가 다음에 다시 설치할 기회가 있다면, 다시 해보도록하자.
3.4 Raspberry 를 이용한 OpenOCD 방법
- Raspberry Pi 와 ESP32 연결
FTDI가 아닌 Raspberry를이용하여 OpenOCD 기반으로 JTAG으로 ESP32를 연결하는 방법인데, 새로운 방법이라 아직 시도는 안해봤지만, 추후 해보도록하자.
상위와 거의 동일하며, FTDI 대신 Raspberry 로 변경된 것으로 보면된다. 추후 VS Code와 연결하여 Debug해보도록 해보자.